Understanding which products generate the highest sales helps businesses make better decisions about inventory planning, purchasing, and marketing strategies. When sales records are maintained manually, it can be difficult to identify which products are performing well and which items are contributing the most to revenue.
Accounting and inventory software can analyse sales data and provide product-wise reports to show frequently sold and high-performing items. Vinimay helps businesses track sales, manage inventory, and access transaction insights in one system, making it easier to identify best-selling products and plan business activities more effectively.
What "Best-Selling" Actually Requires as a Question
Before software—or anyone—can answer "What's my best-selling product?" the question needs to be specific:
Best-selling by quantity: which product has the most units sold?
Best-selling by revenue: which product has generated the most total sales value?
Best-selling by margin: which product is most profitable per unit, regardless of volume?
These can point to completely different products, and knowing which one you're actually asking about changes what the answer looks like.
The Data This Question Depends On
Whichever version of "best-selling" you're after, the underlying data comes from the same place: every sales invoice recorded, broken down by which specific product was sold and in what quantity.
Building the View: Quantity Sold
To rank products by quantity sold, the system needs to total up, for each product, how many units appeared across all sales invoices within a chosen period. A product sold in small, frequent quantities can end up ranking highly here even if each individual sale was modest.
Building the View: Revenue Generated
To rank products by revenue, the same sales data is used differently—instead of just counting units, it multiplies quantity by price for each sale and totals that per product. A higher-priced product sold less frequently can outrank a cheaper, higher-volume one here.
Why These Two Views Can Disagree
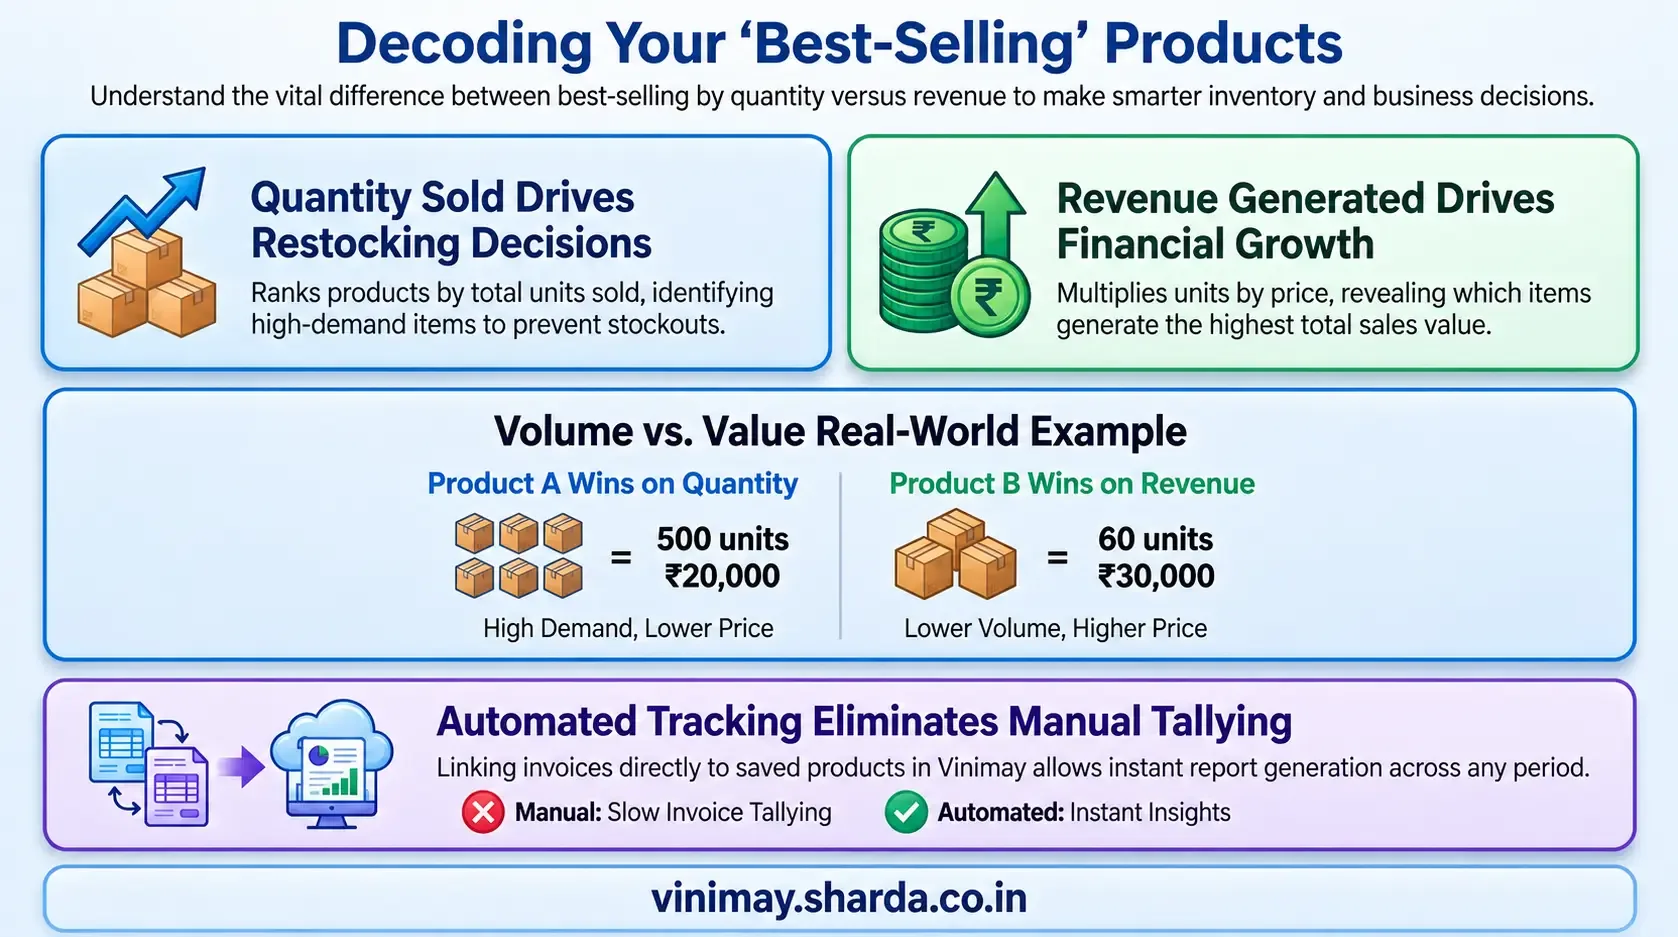
Consider two products: one is a low-cost item sold in large volumes, and the other is a premium item sold occasionally. By quantity, the low-cost item wins easily. By revenue, the premium item might actually generate more total sales value, despite selling far fewer units. Neither view is ""wrong"—they're just answering different questions.
A Worked Comparison
By quantity, Product A is clearly the "best-seller". By revenue, Product B actually generates more total sales value despite selling far fewer units. Depending on what decision you're trying to make—what to restock urgently versus what to prioritise for overall revenue—either view could be the more useful one.
What Makes This Possible Without Manual Tallying
For this kind of view to be available without manually adding up dozens or hundreds of invoices by hand, the underlying system needs a few things in place:
Product management keeps each item as a distinct, trackable entry, rather than a freely typed line on every invoice
Sales records capture every invoice's product-level detail—what was sold, how much, and at what price
Reports: Reports can total this data by product across a chosen time period, rather than requiring manual addition
In Vinimay, because billing and sales records are tied to specific saved products through product management, this kind of per-product view is something that can be built directly from existing sales data, without requiring products to be manually recounted or re-tallied from individual invoices. Whether the specific view you need is by quantity or by revenue, both are calculations built from the same underlying, already-recorded sales data.
Frequently Asked Questions
1. Can I see which product sold the most units?
Yes—this is calculated by totalling the quantity sold for each product across sales records within a chosen period.
2. Can I see which product generated the most revenue?
Yes—this uses the same sales data but multiplies quantity by price per sale, then totals it per product.
3. Why might quantity and revenue rankings show different products?
A low-cost, high-volume product can lead in quantity, while a higher-priced, lower-volume product can lead in revenue.
4. Which ranking should I actually use for restocking decisions?
Quantity sold is usually more directly relevant for restocking, since it reflects actual unit demand.
5. Which ranking is more useful for understanding overall business performance?
Revenue generated often gives a clearer picture of which products actually matter most to overall sales value.
6. Does this require manually going through every invoice?
No—as long as products are recorded as saved items on invoices, this data can be totalled directly rather than manually tallied.
7. Can best-selling products change significantly month to month?
Yes—seasonal demand or promotions can shift which products rank highest between different periods.
8. Is profit margin the same as best-selling by revenue?
No—margin reflects profitability per unit, which is a separate calculation from total revenue generated.
9. What data is needed to build a best-selling products view?
Consistent, product-linked sales records over the period you want to review.
10. Should I check both quantity and revenue rankings regularly?
Yes—reviewing both gives a fuller picture than relying on just one, since they can highlight different products for different reasons.
Related Topics
Published by Team Vinimay
Our editorial and compliance specialists create practical guides, tax calculation rules, and operational strategies to empower Indian small business owners and accountants.